Basic HTML Version


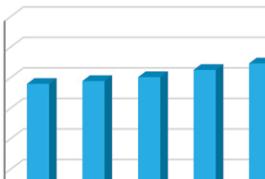
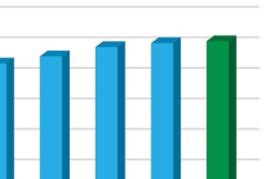

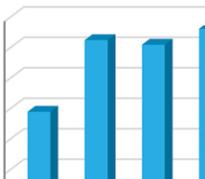

64,000
66,000
68,000
70,000
72,000
74,000
76,000
78,000
80,000
82,000
84,000
2003 2004 2005 2006 2007 2008 2009 2010 2011
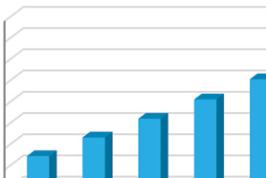
Population Growth
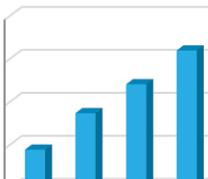
0
5,000
10,000
15,000
20,000
25,000
30,000
35,000
2003 2004 2005 2006 2007 2008 2009 2010 2011
Residential Property Growth
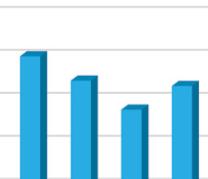
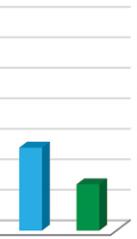
0
50,000,000
100,000,000
150,000,000
200,000,000
250,000,000
2003 2004 2005 2006 2007 2008 2009 2010 2011
Construction value
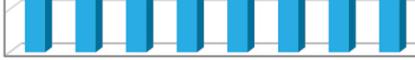
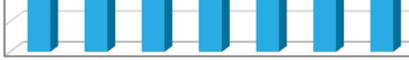
0
200
400
600
800
1,000
1,200
1,400
2003 2004 2005 2006 2007 2008 2009 2010 2011
Building Permits
Statistical Information
2011 City of Chilliwack Annual Report
34